

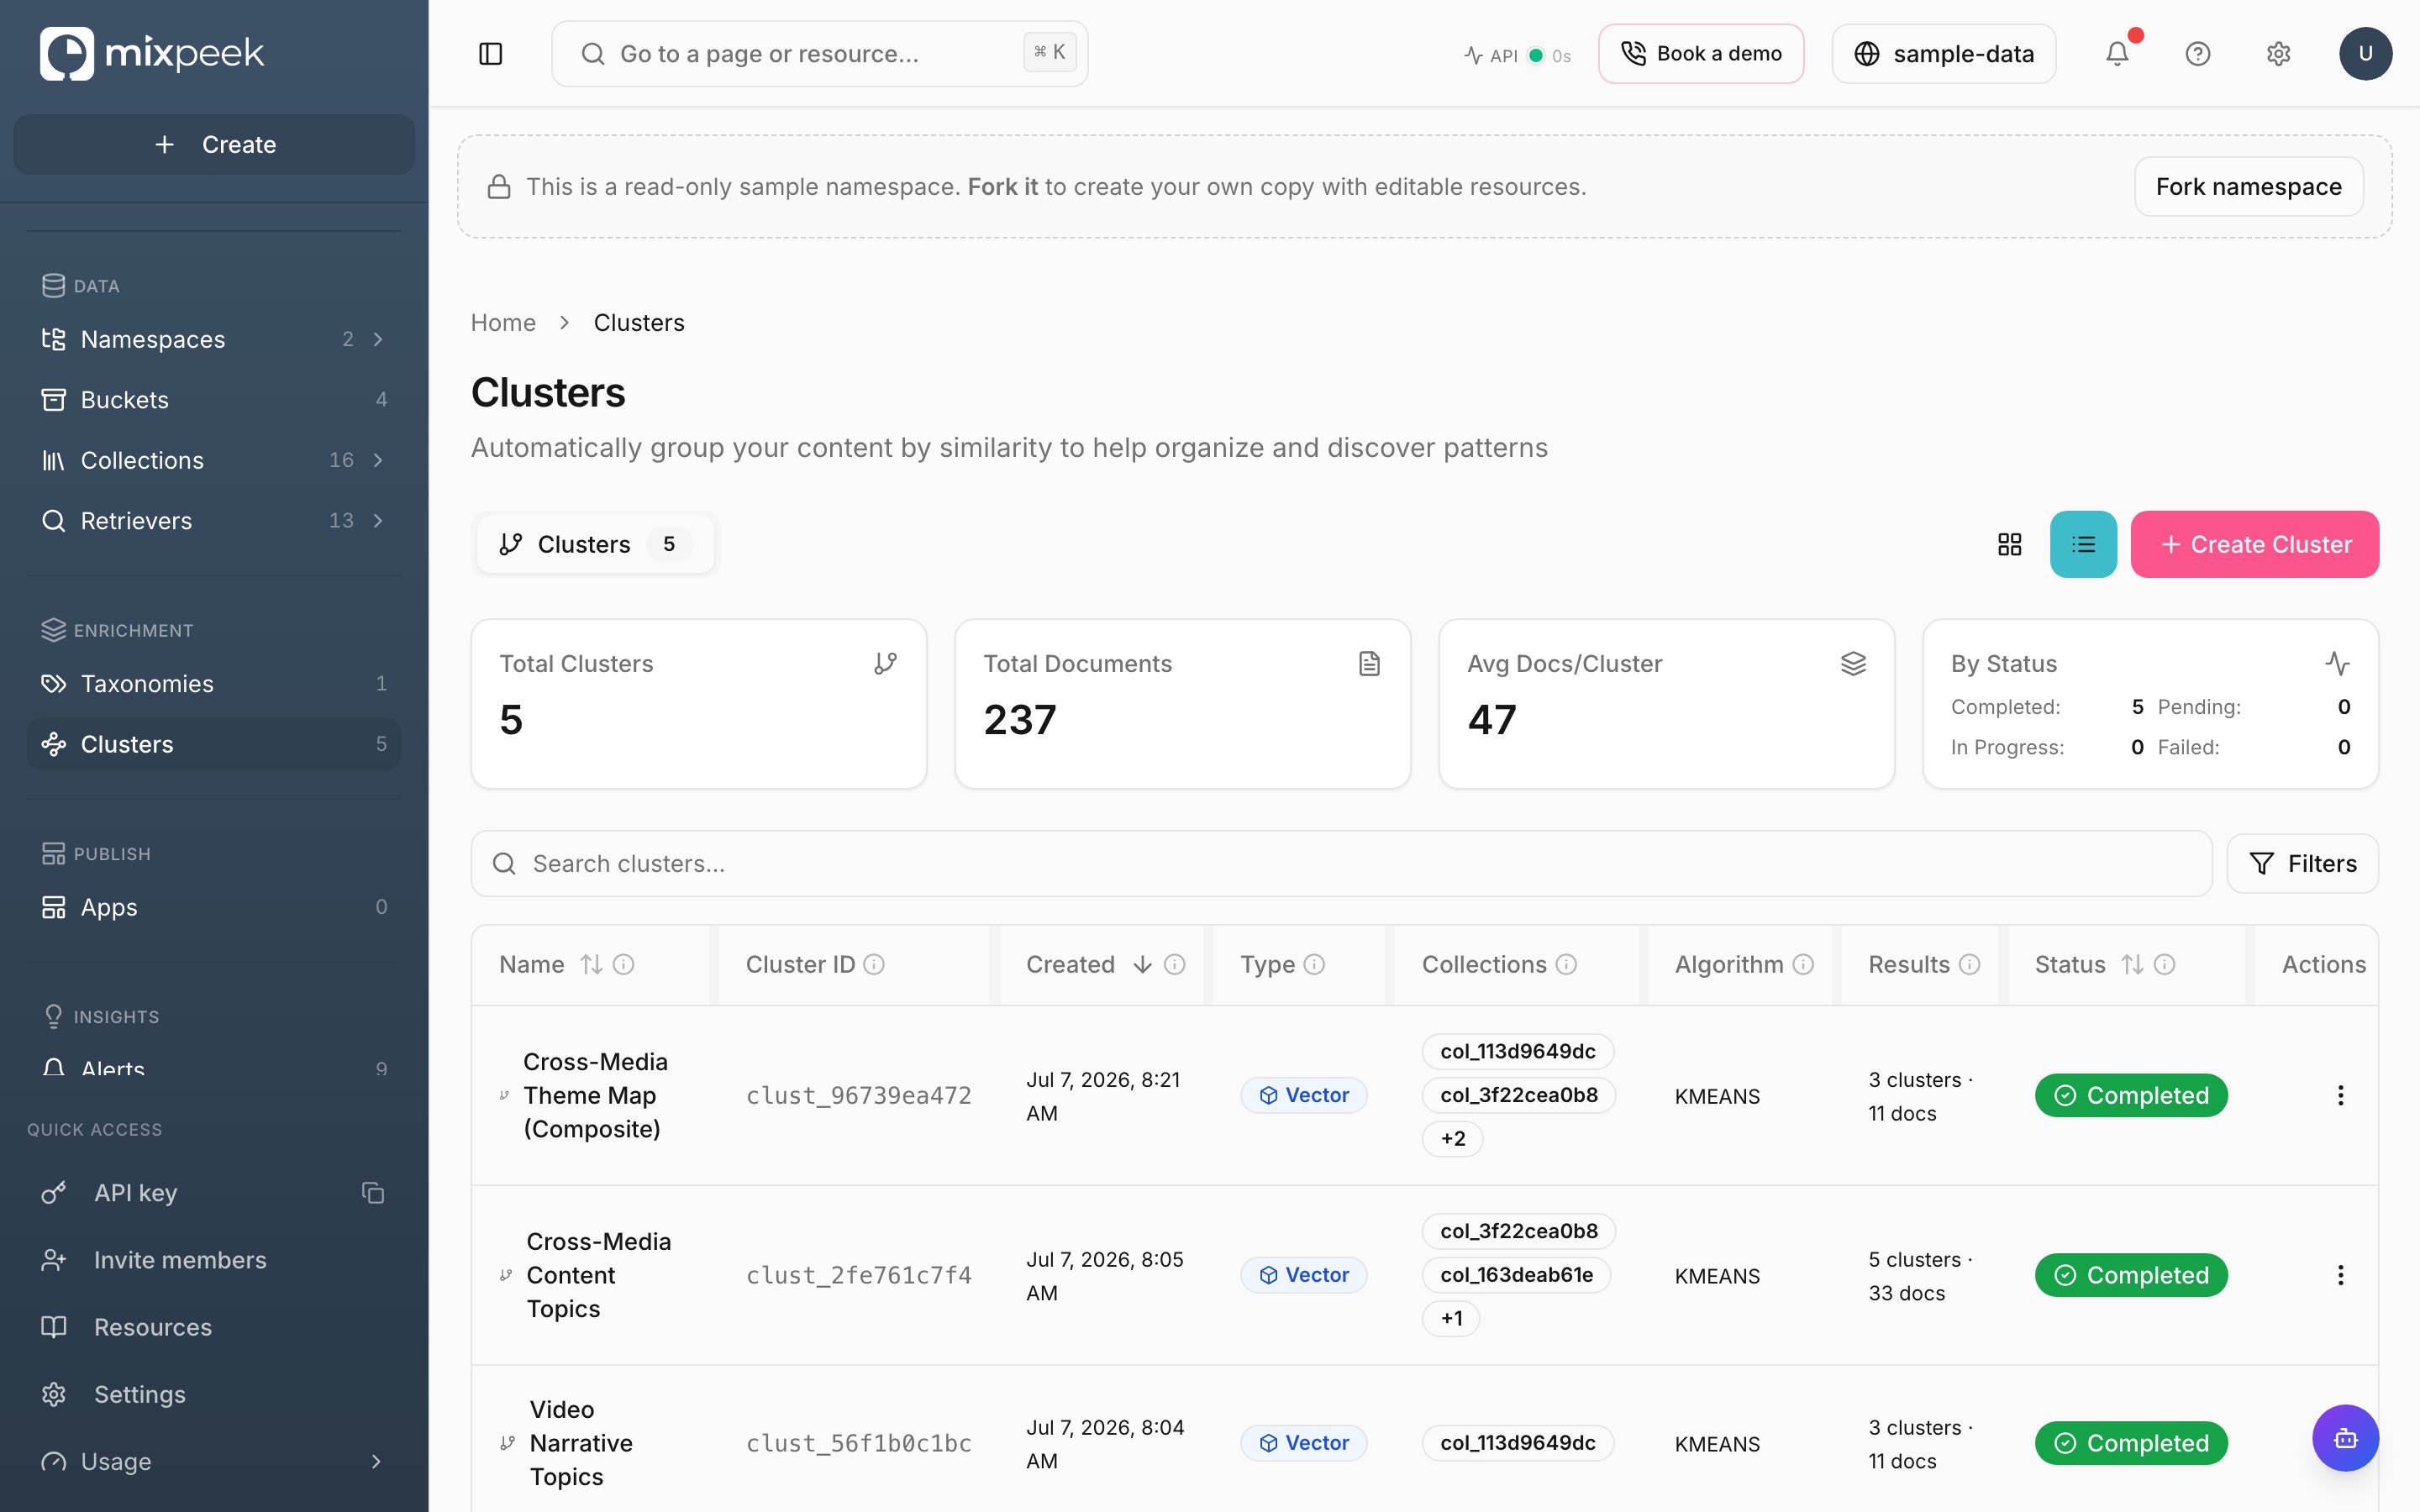
The Clusters page — content grouped by similarity, with the algorithm and run status for each cluster.
Clusters provide warehouse-native grouping, the multimodal equivalent of SQL GROUP BY.
Create and run clustering jobs
- Create: Click New Cluster, select collections, pick vector or attribute clustering, and configure algorithm params. API: Create Cluster.
- Execute: Run the clustering pipeline on the Engine.
modepicks the run:fullreclusters everything,assignadds new documents to existing centroids,compositeclusters the centroids of earlier runs. API: Execute Clustering. - Inspect: Review centroids, metrics, and members if saved. Under Artifacts, download a run’s rows as CSV or Parquet. API: Export Cluster Run Data, which takes a
run_idand returns a presigned download URL. - List/Get/Delete: Manage clustering configurations and results. API: List, Get, Delete.
- Browse results: Read every centroid plus a sample of members, the data behind the scatter plot. API: Cluster Visualization Data. For group labels, summaries, and document counts, use List Cluster Groups.
- Enrich the source collection: Create the cluster with
enrich_source_collectionset to true, and each execution writes cluster labels back onto the source documents. API: Create Cluster.
Choosing an algorithm at scale. For collections over ~100K documents, pick a linear algorithm — K-Means, Gaussian Mixture, or Leiden. The density/graph algorithms that build a pairwise distance matrix — HDBSCAN, DBSCAN, Agglomerative, Spectral, OPTICS, Mean Shift — do not scale past 100K and will error on larger datasets (an N×N distance matrix at 1M rows would need ~7,000 GB of RAM). To run one of those on a large collection, set a
sample_size to cluster a representative subset instead. The create-cluster wizard surfaces this guidance inline when you choose the algorithm.Visualization
The cluster scatter plot maps reduced coordinates to position and size:- x, y → point position on the chart
- z (when
dimension_reduction.componentsis3) → dot size, where larger dots represent higher z-values
Tips
- Start with a sample size to validate parameters before full runs.
- Use LLM labeling for human-friendly labels when vectors are dense and unlabeled.
- Set
dimension_reduction.componentsto3to see depth-based sizing in the scatter plot.
1
Create a cluster job
Choose collections and configure algorithm parameters; optionally set dimensionality reduction.
2
Execute or submit
Run in real-time or submit as an asynchronous job and track via Tasks.
3
Inspect and enrich
Review centroids and metrics. With
enrich_source_collection on, the execution has already written labels onto the source documents.Artifacts such as parquet paths allow downstream analytics and reproducible exploration.