A 0.83 Cosine Is Not 83% Relevant
Scores are ordinal, not cardinal, which is why a fixed threshold silently breaks.
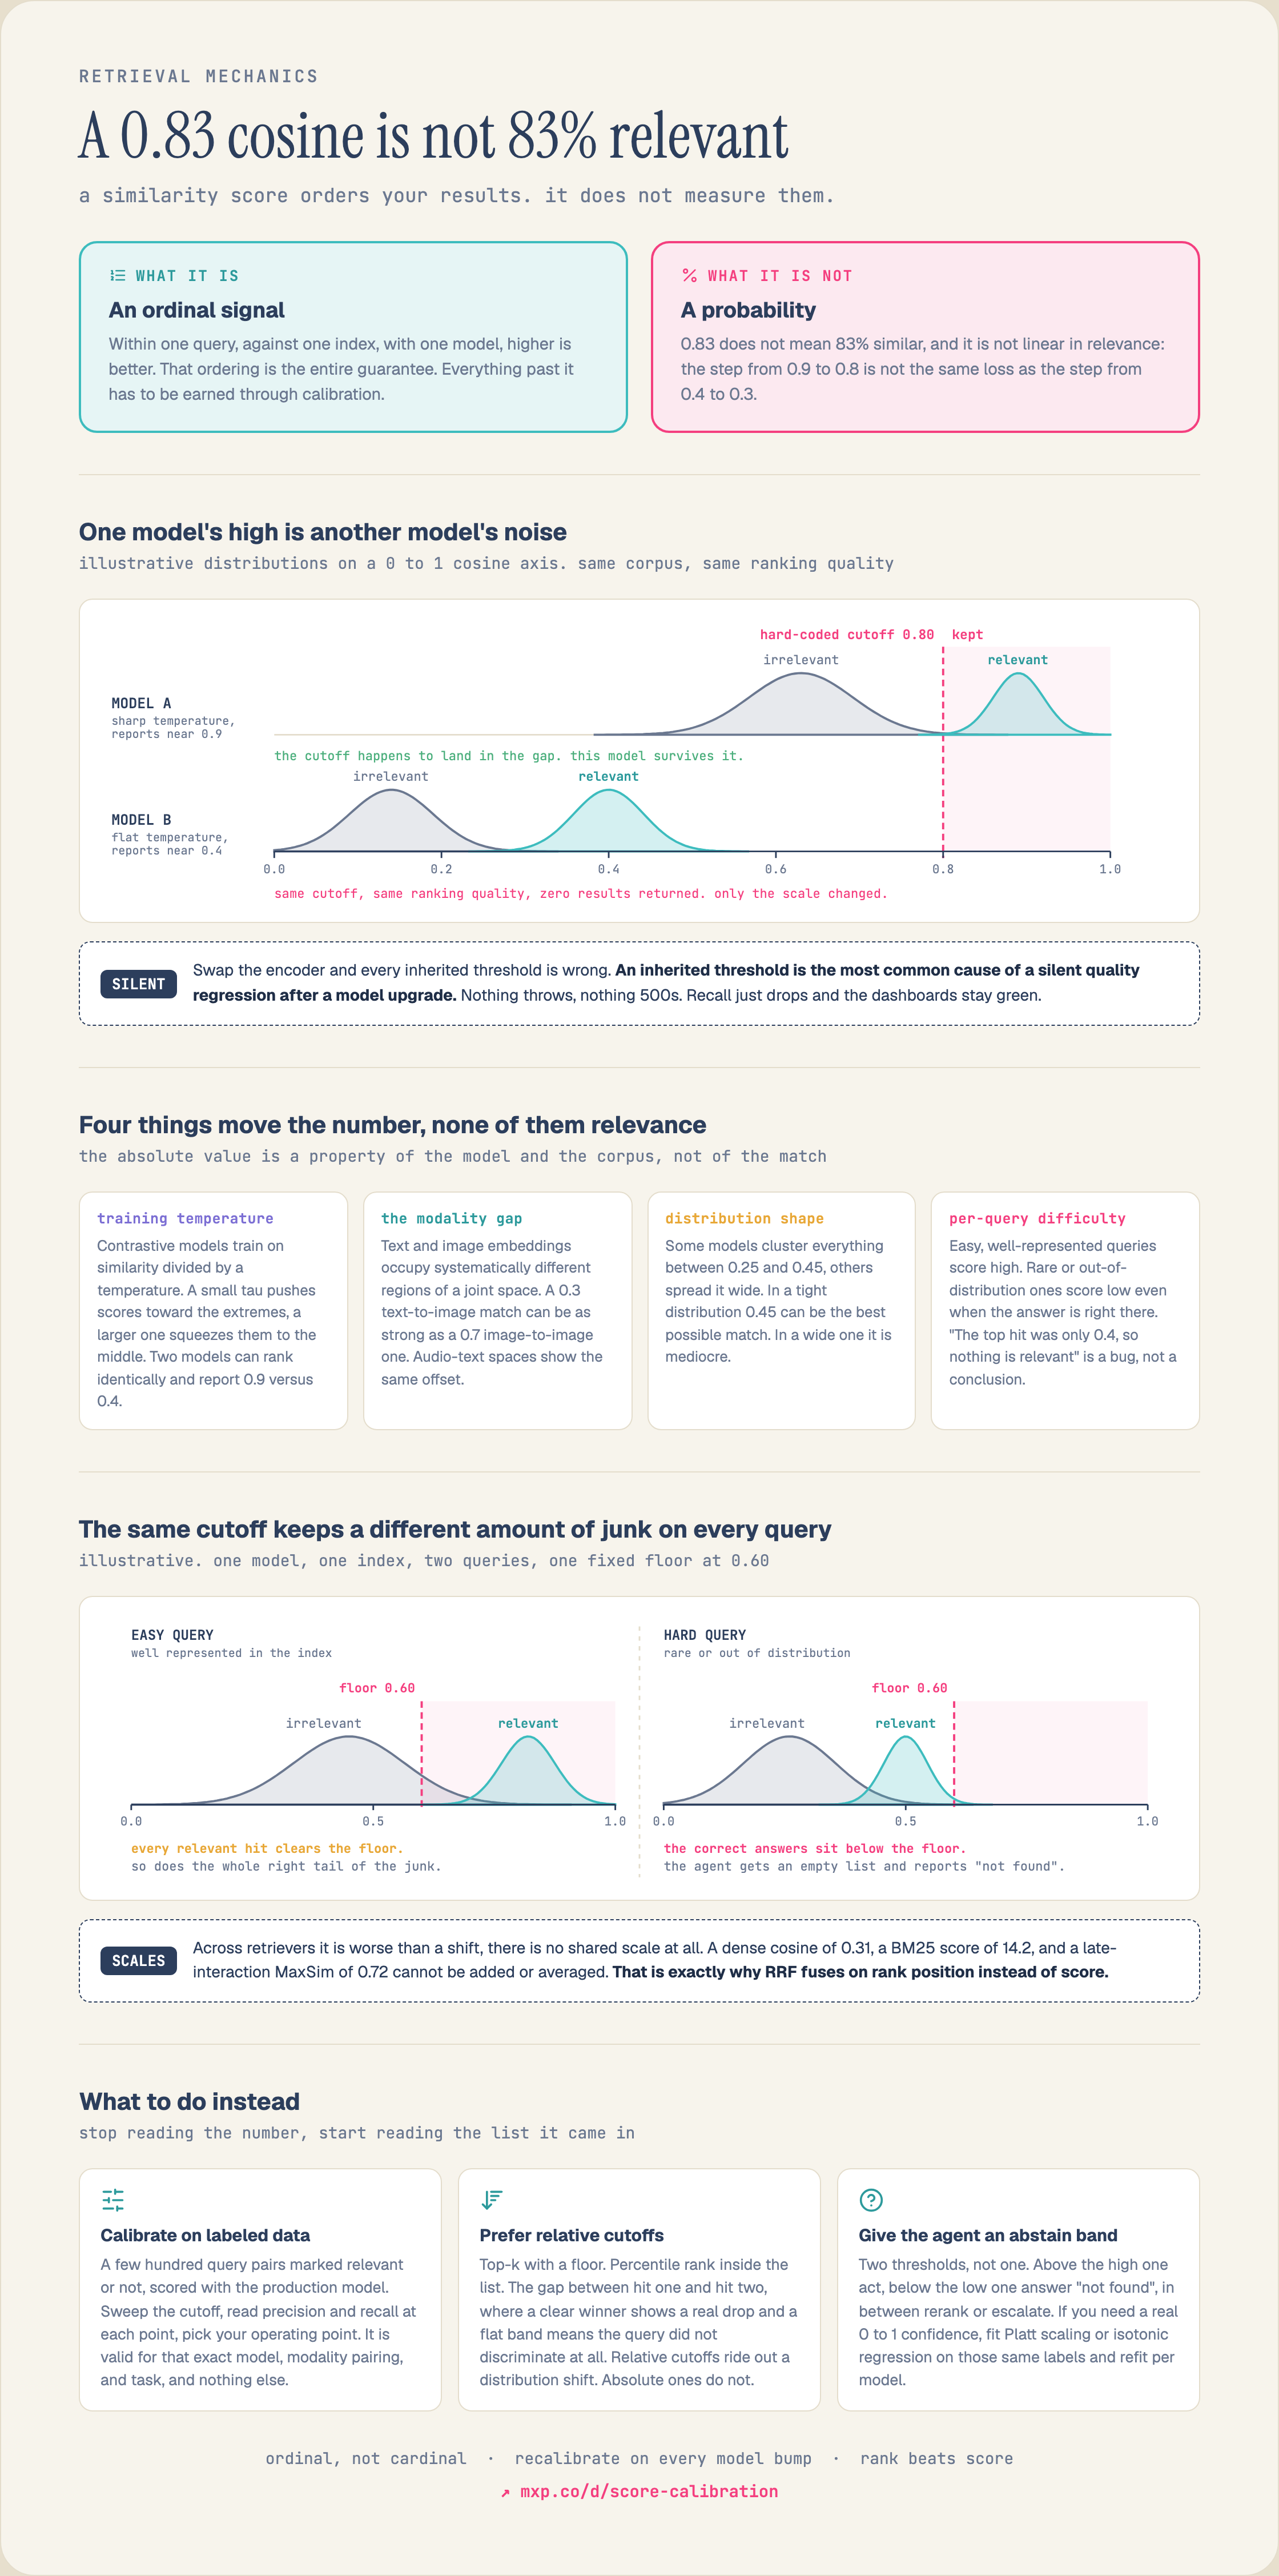
A similarity score is an ordinal signal. Within one query, against one index, with one model, higher is better. That ordering is the entire guarantee. Everything past it, a probability, a confidence, a percentage, has to be earned through calibration.
A cosine of 0.80 does not mean 80% similar. The score is not linear in relevance either: the step from 0.9 to 0.8 is not the same loss as the step from 0.4 to 0.3.
Four independent effects shape the absolute value, and none of them is about whether the result is relevant.
Training temperature. Contrastive models train on similarity divided by a temperature, so a small tau pushes scores toward the extremes and a larger one squeezes them toward the middle. Two models can rank the same results in the same order while one reports around 0.9 and the other around 0.4.
The modality gap. Text and image embeddings occupy systematically different regions of a joint space, so a 0.3 text-to-image match can be as strong as a 0.7 image-to-image one.
Distribution shape. Some models cluster everything between 0.25 and 0.45. In a distribution that tight, 0.45 is the best possible match and a 0.7 threshold returns nothing, forever.
Per-query difficulty. A rare or out-of-distribution query scores lower across the board even when the correct answer is sitting at rank one.
The practical consequence is that a hardcoded threshold is a bug waiting for a model upgrade. It will keep working until someone swaps the embedding model or adds a second modality, and then it will either return nothing or stop filtering anything, silently, with no error. Use rank-based cutoffs, or a score gap between the top result and the rest, or calibrate against labelled pairs per model and per modality pair. Whatever you pick, re-derive it when the model changes.
Where this diagram appears
Run this on your own data
Mixpeek turns video, images, audio, and documents in your object storage into searchable, timestamped results through one API.
Search your own data