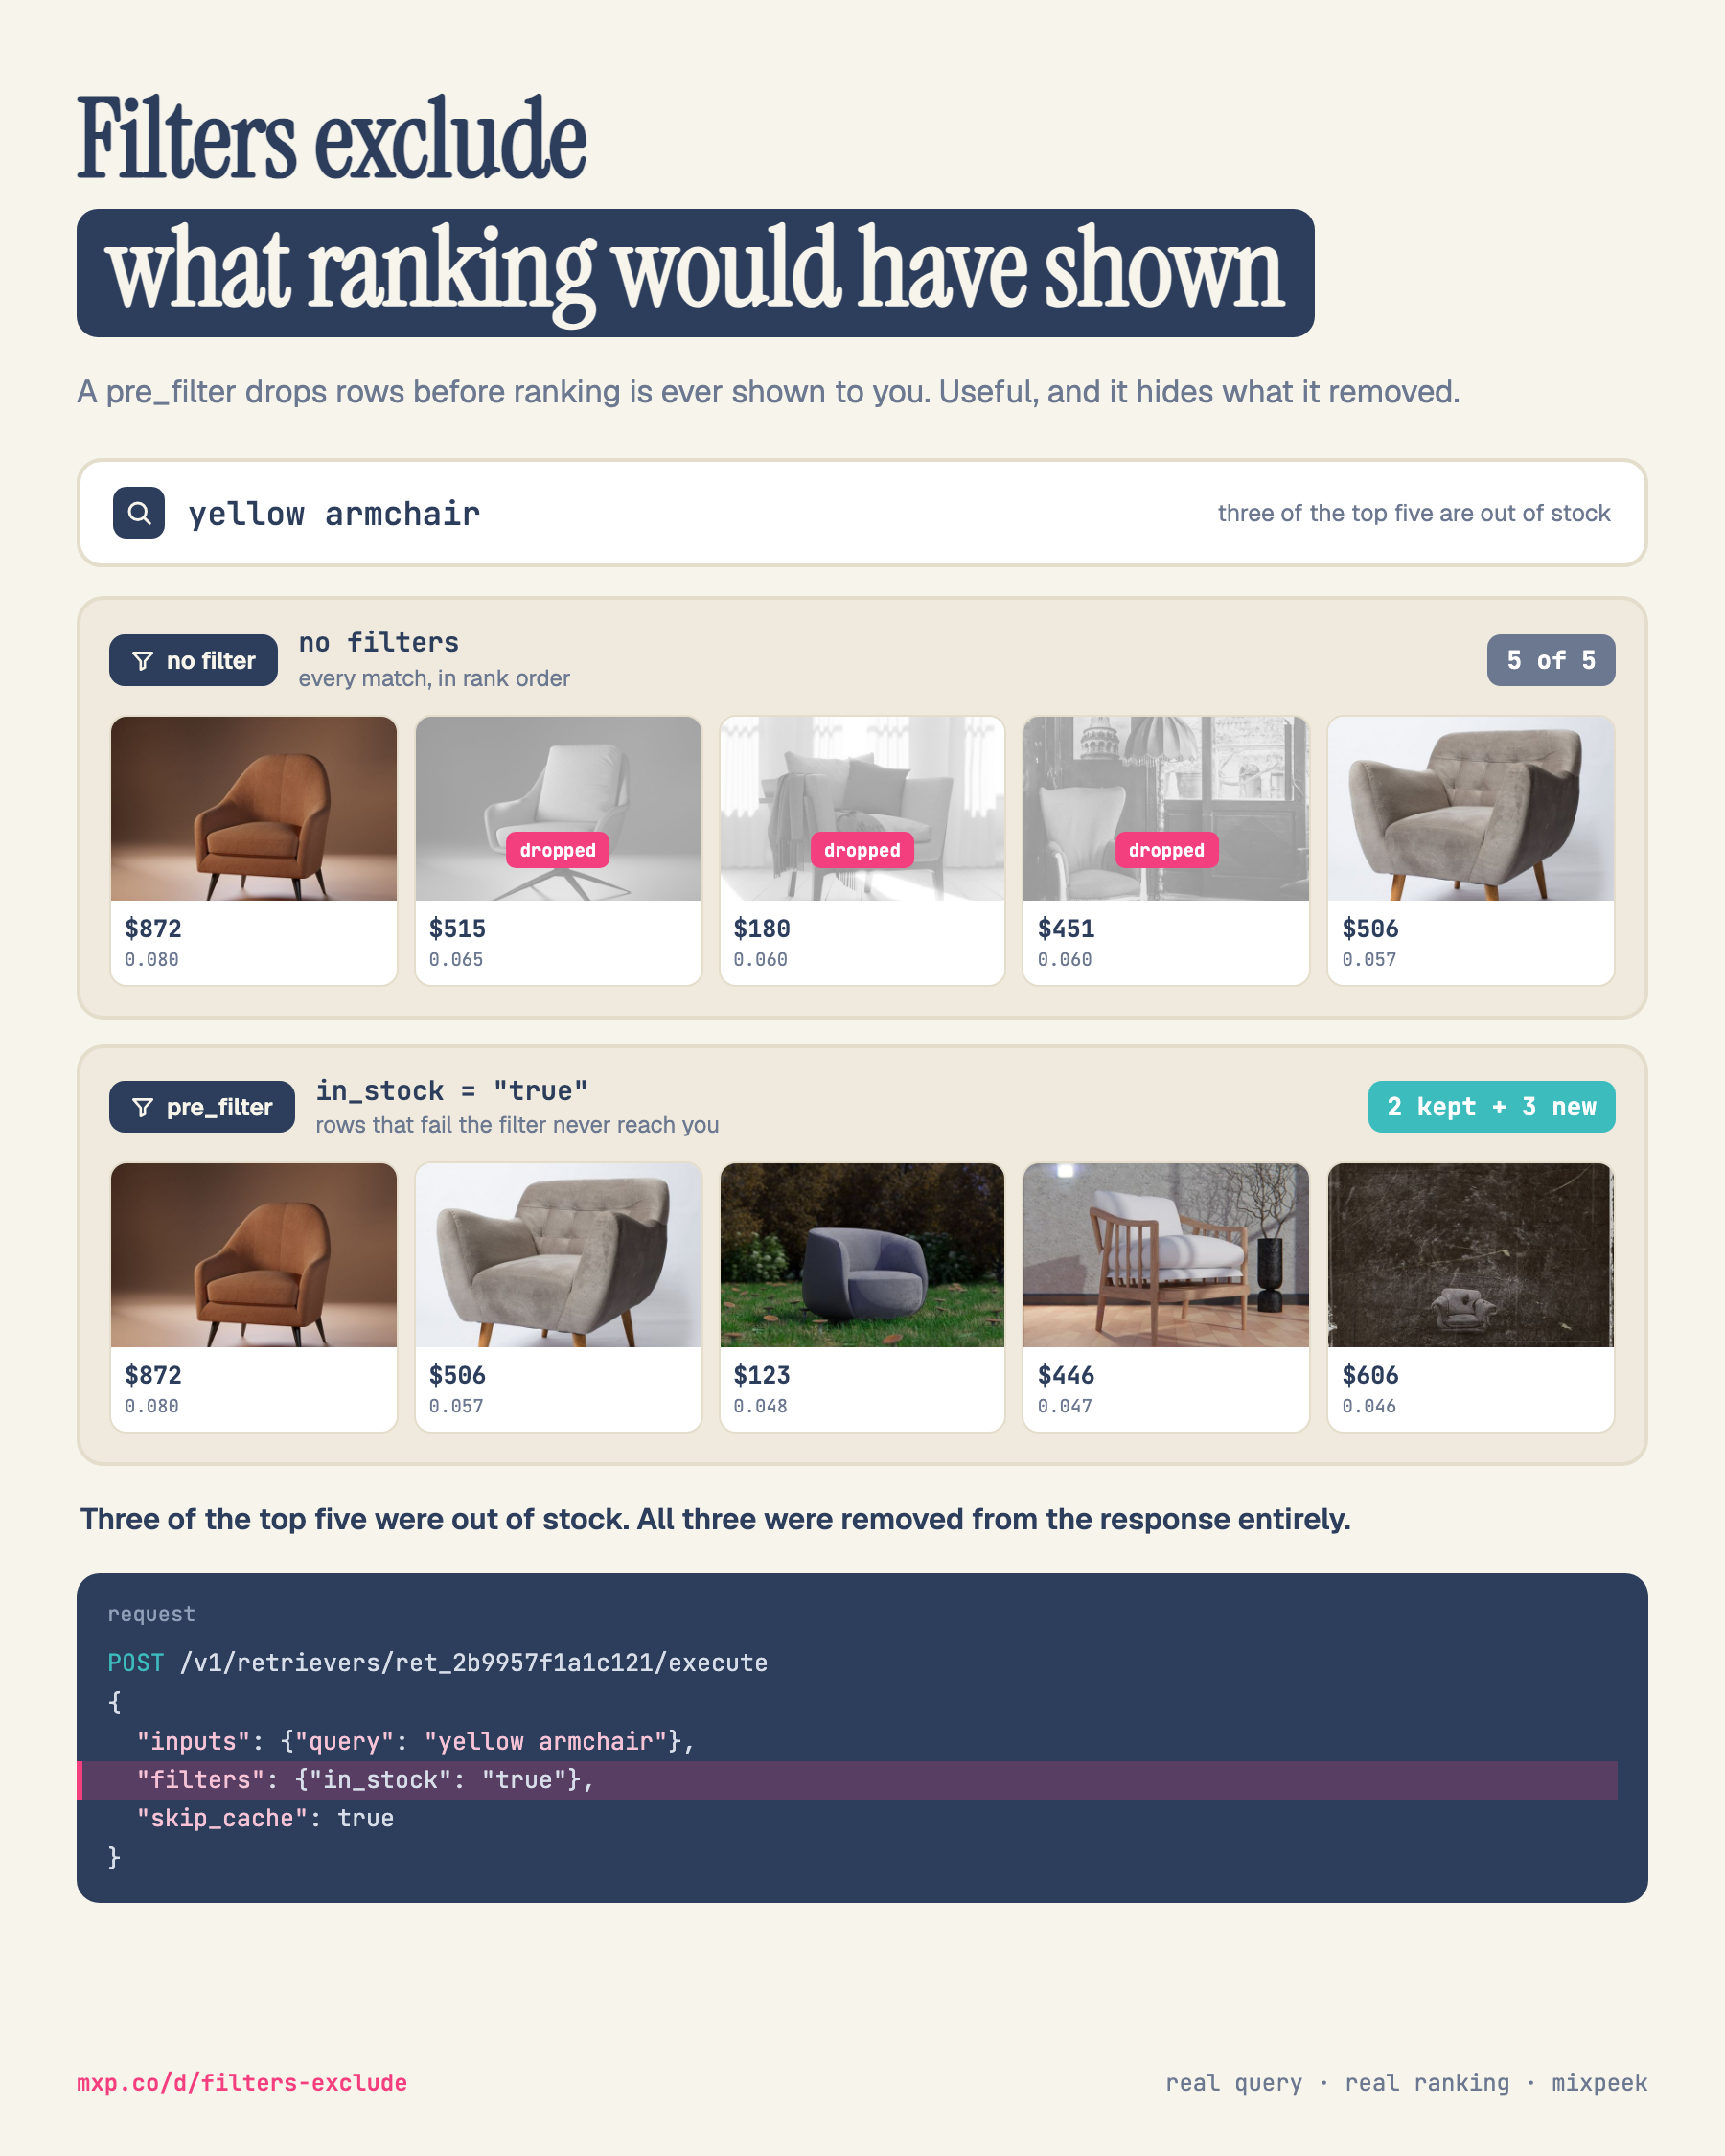
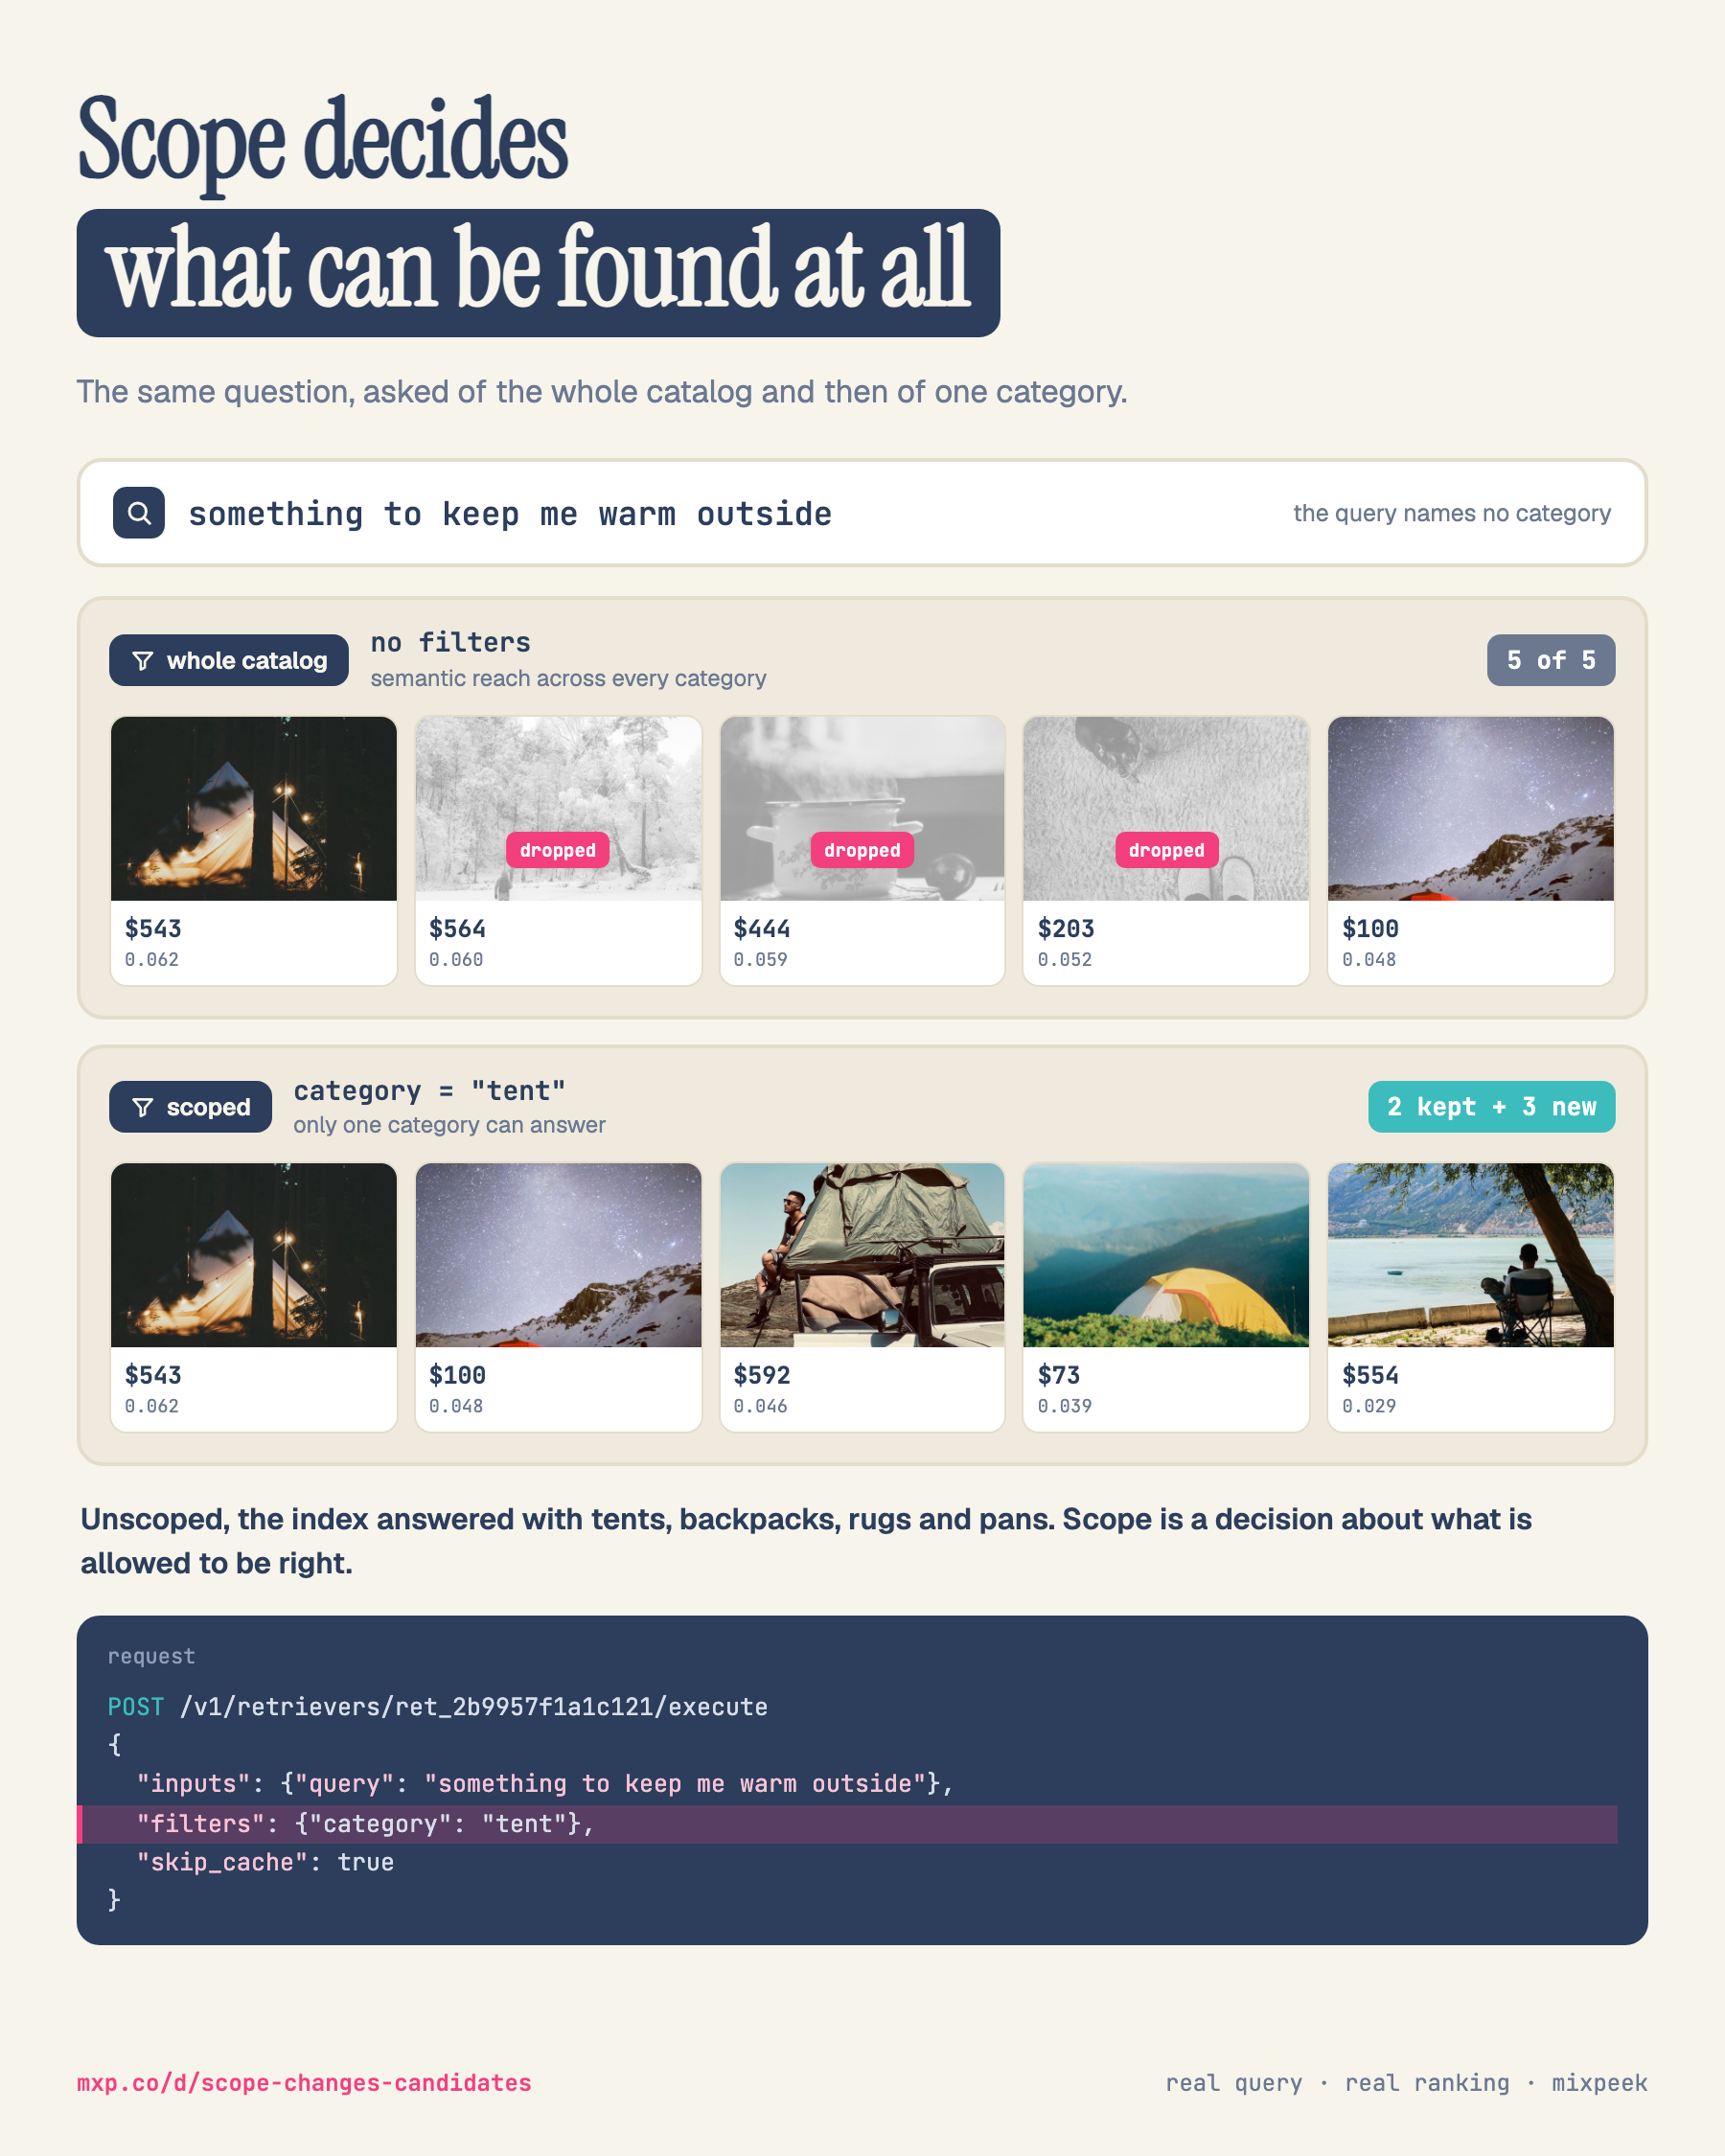
A Nine-Second Day Disappears Into a Two-Second Average: What Temporal Windows Show That a Mean Hides
Mixpeek writes every retriever execution into mxp_retriever_executions in your own namespace, so a retriever can read your own telemetry. Grouped by day, one window on 2026-09-04 averaged 9,397 ms against neighbours near 2,500, on only 10 executions. Averaged across the full period that day contributes almost nothing and disappears; bucketed by day it is the tallest bar on the chart.
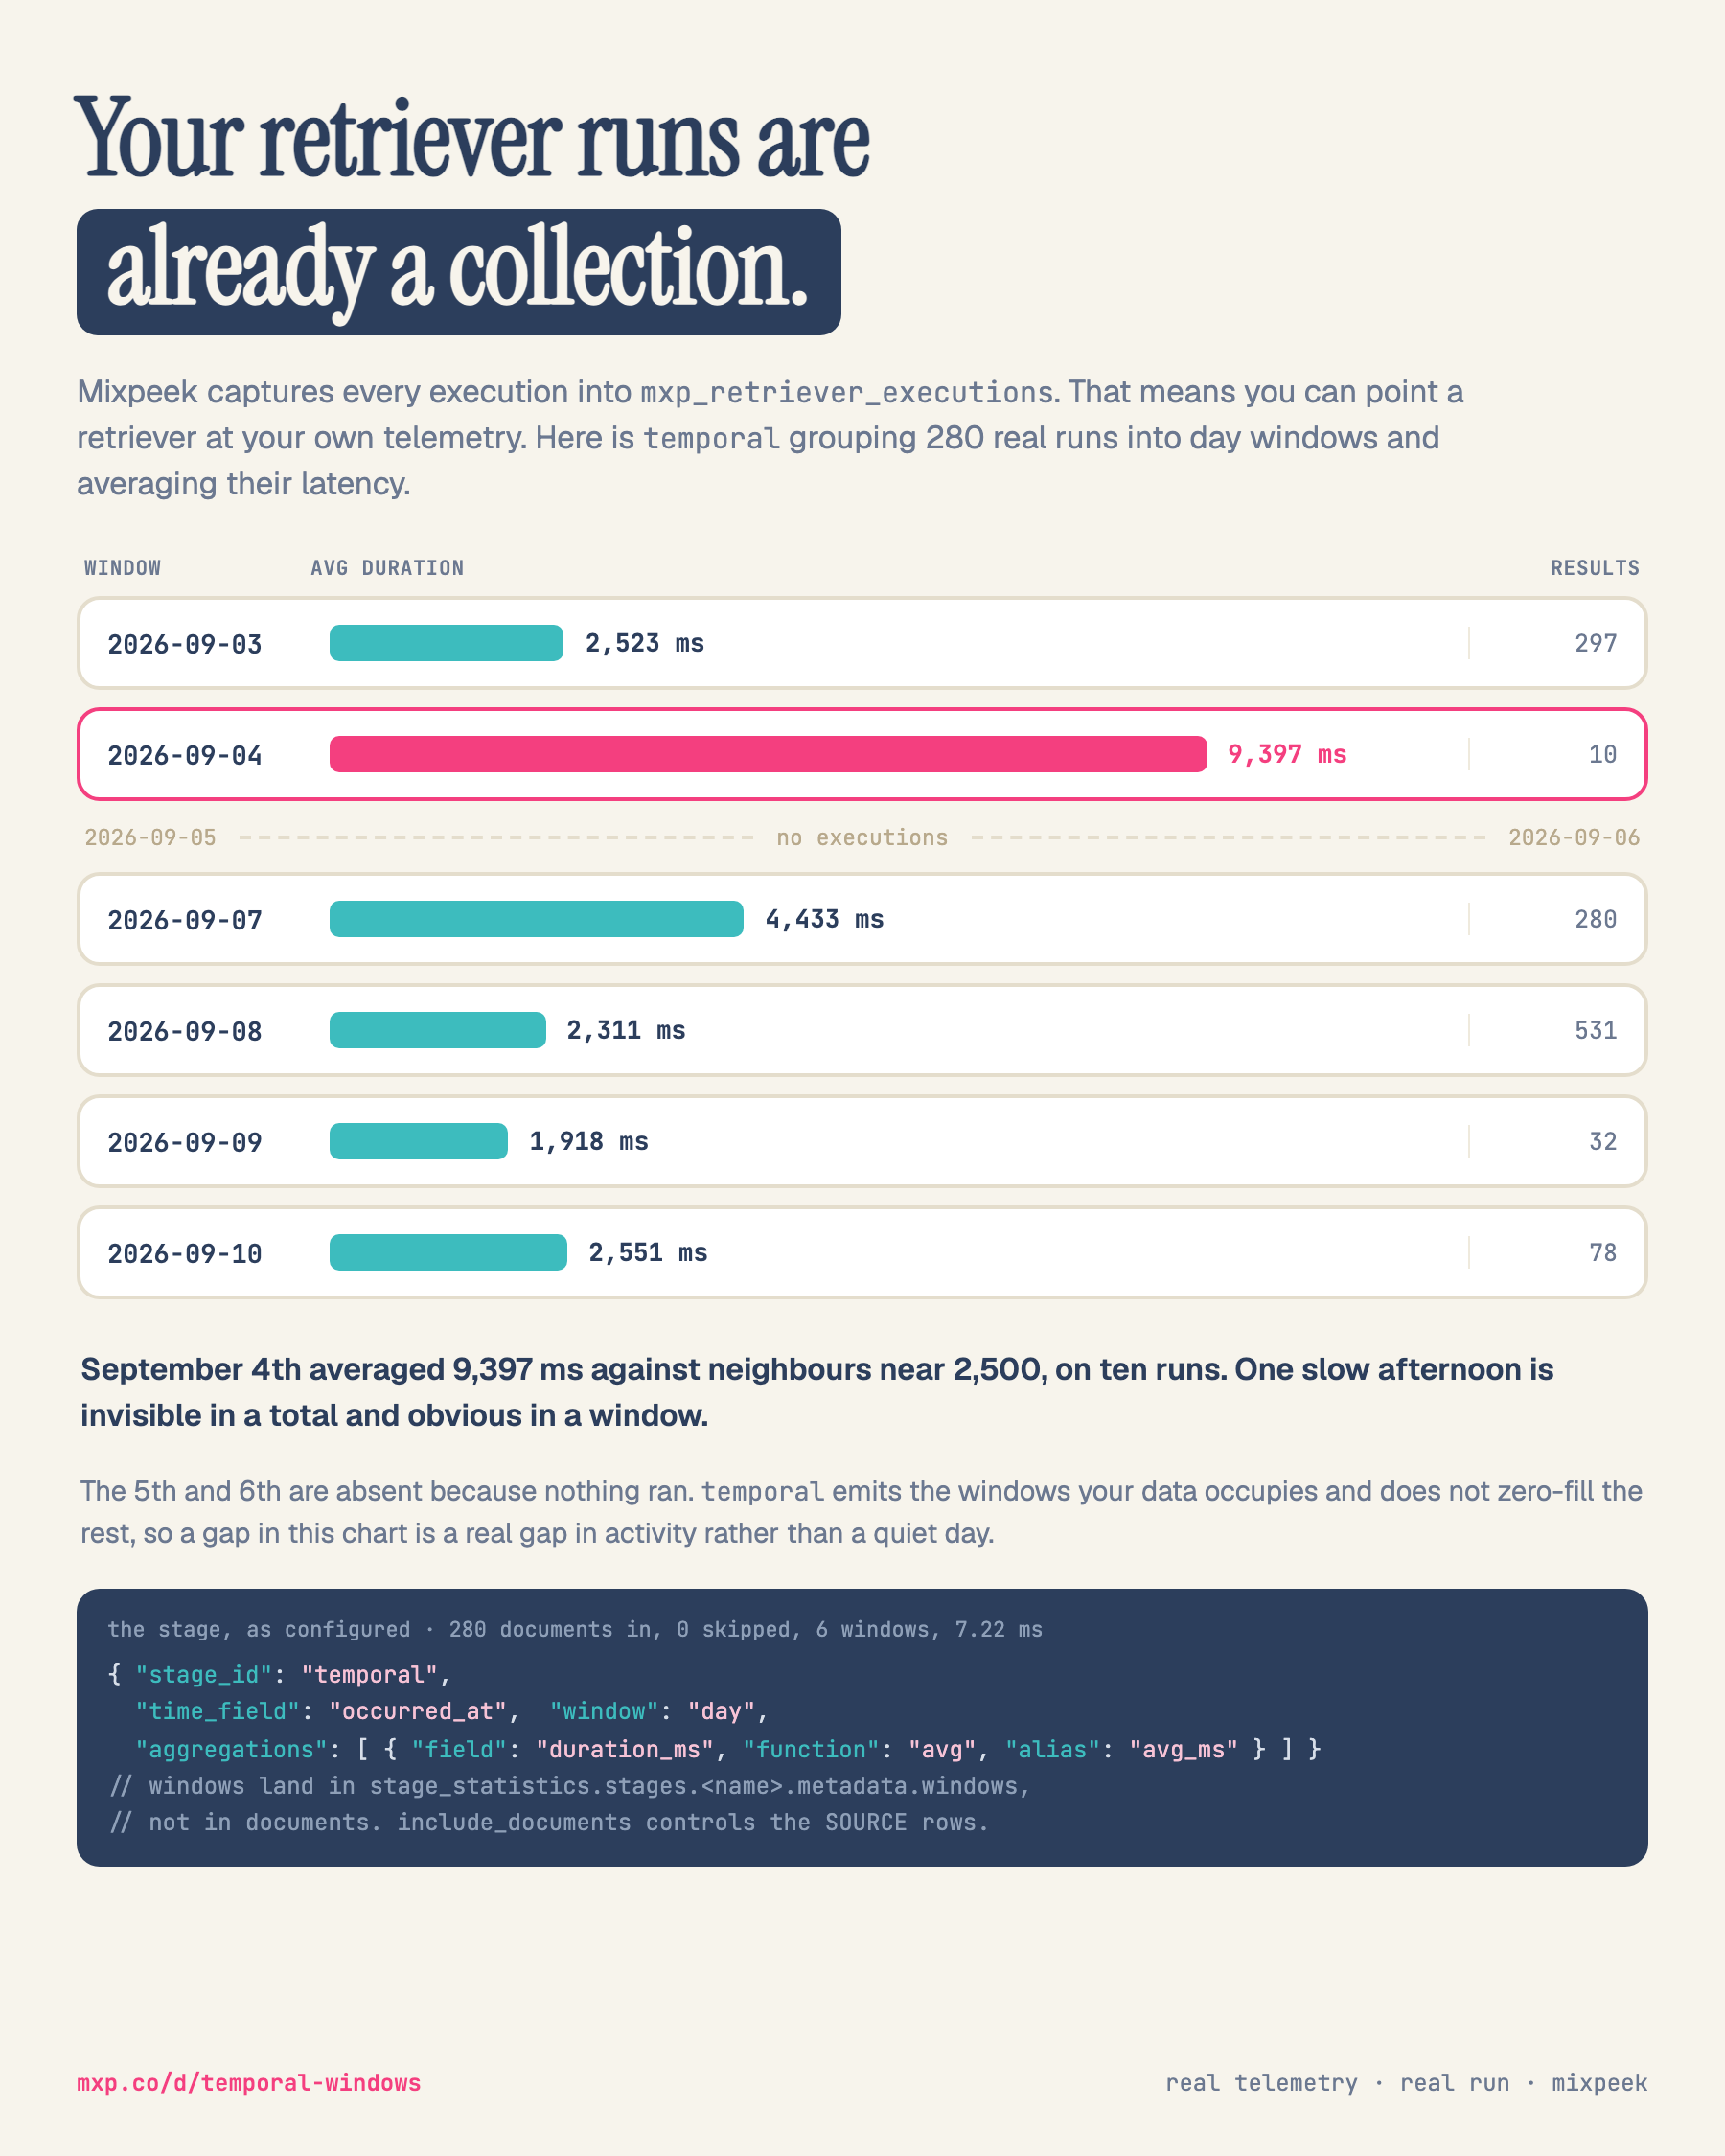
Mixpeek writes every retriever execution into mxp_retriever_executions in your own namespace. It is a collection like any other, which means a retriever can read it. This diagram is the temporal stage grouping 280 of those executions into day windows and averaging their latency.
September 4th is the window worth looking at: 9,397 ms average against neighbours near 2,500, and only ten executions behind it. Averaged across the whole period that day contributes almost nothing and disappears into the mean. Bucketed by day it is the tallest bar on the chart, and it is exactly the kind of thing a single rolled-up average is built to hide.
The 5th and 6th have no bar because nothing ran. temporal emits the windows the data actually occupies and does not zero-fill, so a missing bar is a real gap in activity rather than a quiet day rendered as zero. That distinction matters before plotting the output anywhere that assumes a continuous series.
One thing about this stage catches people building with it for the first time: the windows live in stage_statistics.stages.<name>.metadata.windows, not in documents. include_documents controls whether the source rows pass through to documents; with it false, documents is empty and output_count reads 0, which looks exactly like a stage that did nothing. It had already done all of it. A reduce stage's product may not be documents at all, so its metadata block is worth reading before concluding it produced nothing.
Getting to this collection at all needed a second stage first. mxp_retriever_executions carries vector_indexes: [] and no vectors, so feature_search cannot source from it. attribute_filter can, since as a first stage it fetches directly rather than requiring a prior vector search. Running it that way, roughly a third of otherwise identical runs came back with zero documents; every one of those was discarded as unmeasured rather than counted as a result, and the numbers on this diagram come only from runs that actually delivered documents.
Every number on the image traces to one execution against col_60783f4a99 in ns_cbb394f1a5, skip_cache true: 280 documents in, 0 skipped, 6 windows, 7.22 ms of stage time.
Where this diagram appears
Run this on your own data
Mixpeek turns video, images, audio, and documents in your object storage into searchable, timestamped results through one API.
Search your own data